When is Chi-Squared the correct test?
- you have nominal data;’ this means that the Pps do not have a “score” and it is not possible to rank them for this reason, all that has happened is that the Pps have been assigned to a category, they will appear as tallies in a frequency table. Always ask yourself does each ppsd have a score of some sort? If so it is not nominal! If they have a category e.g. symptoms increased/symptoms decreased then it is nominal!
- an independent measures design
 How to do a Chi Squared:
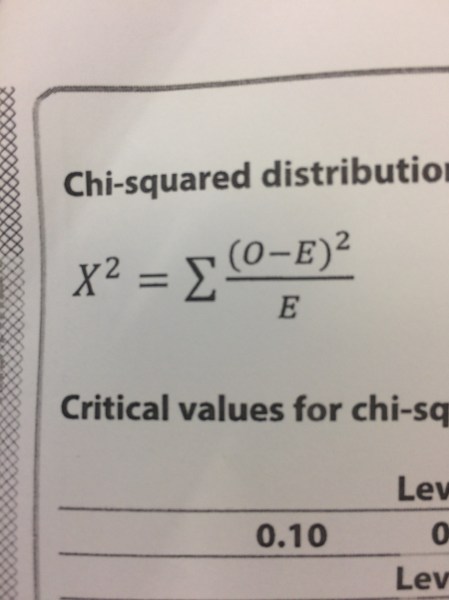
You will need the formulas from the front of the exam booklet to help you to remember how to work this out. However, the formula does not tell you how to calculate the expected frequencies (E). You need to remember this yourself.
Working out the expected frequencies: It is super-easy. For each cell in the table you need to take the row total and multiply if by the column total and divide by the total number of tallies.
Now follow the formula;
I suspect they would give you some sort of table to help you with this calculation but if not it is really quite easy, here are the stages:
- Work out the expected frequency for each cell (you will only be doing 2 x 2 frequency tables so 4 cells in total called A,B,C and D. You will need to know the row total and column total for each cell, then for each cell multiply the relevant row and column totals together and then divide by the total. You can practice this on the example below.
- Once you have the expected frequencies for each cell, the fun starts; follow the formula here; do cell A first, take the bits in brackets first; O-E, that is observed frequency (number of tallies in the cell) minus the expected frequency for cell A
- Now square the answer
- Now divide the answer by E (expected frequency)
- Repeat this process for cell B, C and D
- Now add the whole lot up: A+B+C+D
- This will give you your chi-squared value and you are now ready to look it up in the critical values table to see whether it is significant.
- Remember…
- are you using a directional or non-directional hypothesis, this will determine whether you are doing a one or a two tailed test
- Start with the 0.05 level of significance
- Think about how many degrees of freedom you have, this is the number of rows minus 1 multiplied by the number of columns minus 1; hence with a 2X2 table, the degrees of freedom (df) is always equal to one
- Now you can look up the critical value and compare this with your observed value; your value must be bigger to be significant. If it is, you can accept your hypothesis and reject the null (p<0.05, meaning that the probability that the null hypothesis is correct or that the results are due to chance is less than 1 in 20).
- When you report your stats test be sure to always quote both the observed and critical value in your answer and make sure you always relate back to the actual hypothesis from the extract to contextualize fully.
learning-reseaerch-exercise-chi
learning-reseaerch-exercise-chi-worked-example
Practice Questions: chi-squared-practice-question-1
- A recent study has shown that bumblebees can learn to pull strings to receive food treats by observing one another. In the first part of the study, scientists observed 110 “control bees” to see whether any of them would pull a string in order to get to a sweet treat. Only 2/110 bees pulled the string. The scientists called them “innovator bees”. Next, the scientists put a second set of bees behind a glass panel, where they could see the innovator bees pulling the strings to receive the treats. They then tested these “experimental bees” to see whether any of them would pull the strings themselves. 60% of this group pulled the strings when given the opportunity to do so suggesting that bees are capable of social learning.
- What is the dependent variable in this study? (1)
- Give a suitable directional hypothesis for this study (2)
- Professor Bea Swacks decided to replicate the study with a small number of bees, as she was so excited by these fascinating results. Her findings are on the next page.
| Pulled the string to receive a treat | Did not pulled the string to receive a treat | ||
| Cell A | Cell B | Row total: | |
| Did not observe innovator bees before being faced with the string pulling challenge | 3 | 12 |
………………………….. |
| Cell C | Cell D | Row total: | |
| Observed innovator bees before being faced with the string pulling challenge | 8 | 6 | ………………………….. |
| Column total: | Column total: | Total of all observations: | |
|
…………………………..
|
………………………….. |
………………………….. |
|
Cell A Expected frequency (1):
……………………………..
|
Cell D Expected frequency (1):
……………………………..
|
| Show your workings here (2): | Show your workings here (2): |
Professors Swacks conducts a chi squared test to analyse her results. She asks you to help her by calculating the expected frequencies cells A and D. First of all complete the table above with the row and column totals and total number of observations. Now, complete the calculation for the expected frequencies for cells A and D, showing your working in the spaces provided.
Professor Swacks thanks you for your help and carries out the rest of the calculation by herself. Her observed value is: 4.24. She completes a one-tailed test as her hypothesis was directional based on the previous study.
- Using the critical values table from your mock exam, state whether she should reject her null hypothesis (1)
- Explain your answer: (3)
For answers click here
Another sample questions with answers:
Jane was interested to know whether people with schizophrenia were any more or less likely to have a romantic partner than people without schizophrenia. She wasn’t sure what the outcome would be.
| Romantic Partner | ||
| Yes | No | |
| Has schizophrenia | 10 | 7 |
| Does not have schizophrenia | 17 | 6 |
- Write a non-directional null hypothesis for Jane’s study. (2)
- Explain which statistical test Jane would use for her study (3)
- Calculate chi squared to 2 decimal places. (4)
- Explain whether Jane should reject her null hypothesis or not (you will need a critical values table) (3)
Answers for Jane’s study questions
Click here for a canva lesson on chi squared.
